
 Tiếng Việt
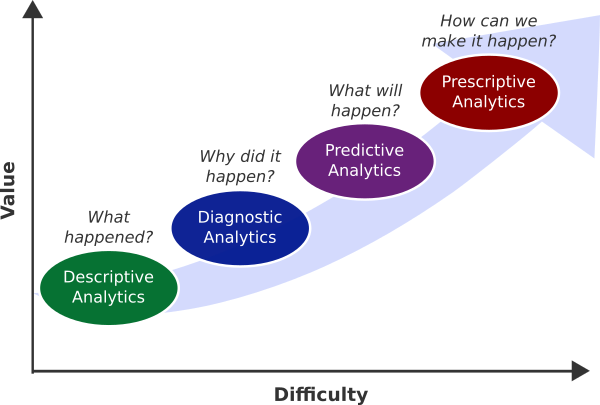
Abstract: In the previous article, data acquisition and pre-process layer was introduced. After acquiring clean data, data analysis task should be performed. Analysis of data is a vital part of running a successful business. When data is used effectively, it helps businesses have better decision-making for their future activities. There are various types of data analysis that will be introduced in this article such as correlation analysis, statistic analysis, descriptive analysis, distribution analysis, diagnostic analysis, predictive analysis, prescriptive analysis, and so on.
They are all linked together and build upon each other. They can be the simplest type to more complex. The more complex it is; the more valuable insight it adds.
1. Statistic analysis

(Source: BeingDatum)
Statistical analysis is the science of collecting, exploring, and presenting large amounts of data to discover underlying patterns and trends. Note that the keyword here is “statistic”. Statistics are applied every day – in research, industry, studying – to become more scientific about the decisions that need to be made. Some applications:
- Manufacturers use statistics to weave quality into beautiful fabrics, to bring a lift to the airline industry, and to help guitarists make beautiful music
- Researchers keep children healthy by using statistics to analyze data from the production of viral vaccines, which ensures consistency and safety.
- Communication companies use statistics to optimize network resources, improve service and reduce customer churn by gaining greater insight into subscriber requirements.
- Government agencies around the world rely on statistics for a clear understanding of their countries, their businesses and their people.
Traditional statistic methods have been used for a long time. However, Internet of Things (IoT) data volumes make statistics more valuable and powerful. Statistical computing has become more and more essential for today’s statistician.
2. Correlation analysis
Correlation analysis Is a statistical method used to evaluate the strength of the relationship between two quantitative variables. A high correlation means that two or more variables have a strong relationship with each other, while a weak correlation describes that the connection between two variables is hardly related. In other words, it is the process of studying the strength of that relationship with available data. Correlations are useful because if the relationship between the two variables is detected, the future behavior can be predicted. A correlation coefficient is a way to show how strong the relationship between variables.
The correlation coefficient has a value of between -1 and 1. “0” stands for no relationship between variables at all, while -1 and 1 mean that there is a perfect negative or positive correlation. The direction of the relationship is indicated by the sign of the coefficient; a + sign indicates a positive relationship and a – sign indicates a negative relationship. Correlation relation can be described as a plot or matrix below
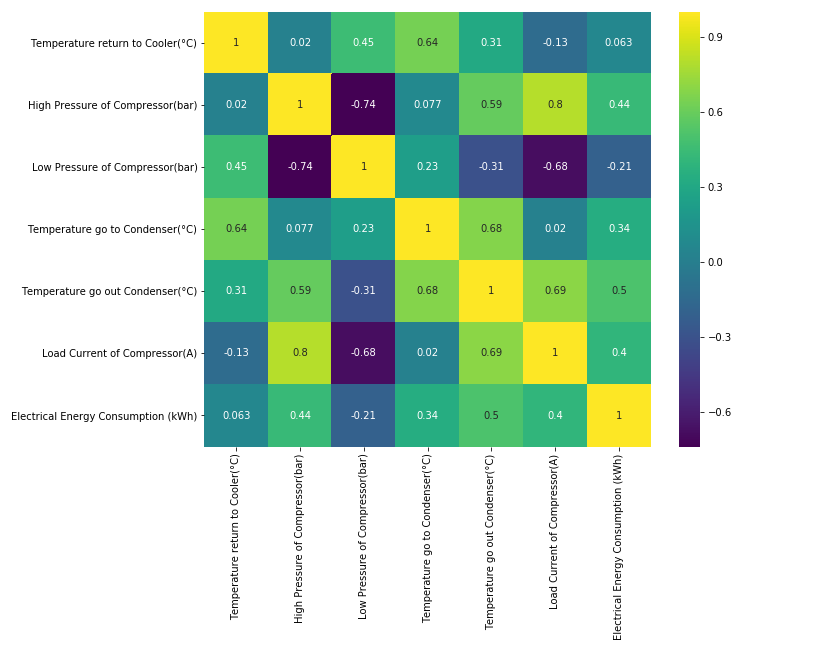
(Example of Correlation analysis of Chiller analyzed by Daviteq research and developement team)
The matrix above shows the example of the correlation between each feature of Chiller machine in the factory. It indicates which feature affected the electrical energy consumption of the chiller machine. From that result, a better optimization method for the chiller will be considered and recommended. It leads to the reduction of electrical energy in manufacturing. In general, by detecting correlation of all features, it helps the manufacturer to optimize the resource.
3. Descriptive analysis
Descriptive statistics are used to describe the basic features of the data in a study. They provide simple summaries about the sample and the measures. Together with simple graphics analysis, they form the basis of virtually every quantitative analysis of data. With descriptive statistics, the data can be described with various dimensions. Descriptive statistics simply describes what is going on in our data.
Descriptive Statistics are used to present quantitative descriptions in a manageable form. In manufacturing, we may have a lot of measurements. Descriptive statistics help to simplify large amounts of data in a sensible way. In other words, descriptive statistic reduces lots of data into a simpler summary. Although descriptive statistics may have limitations, it provides a powerful summary that may enable comparisons across units. There is 3 common type of descriptive analysis include the distribution, central tendency, and dispersion.
a. The distribution
The distribution is a summary of the frequency of individual values or ranges of values for a variable. One of the most common ways to describe a single variable is with a frequency distribution. Depending on the particular variable, all of the data values may be represented, or data may be grouped into categories first. Frequency distributions can be depicted in two ways, as a table or as a graph. Frequency distribution can be depicted in a graph as show in figure below. This type of graph is offten refrerred to as a histogram.
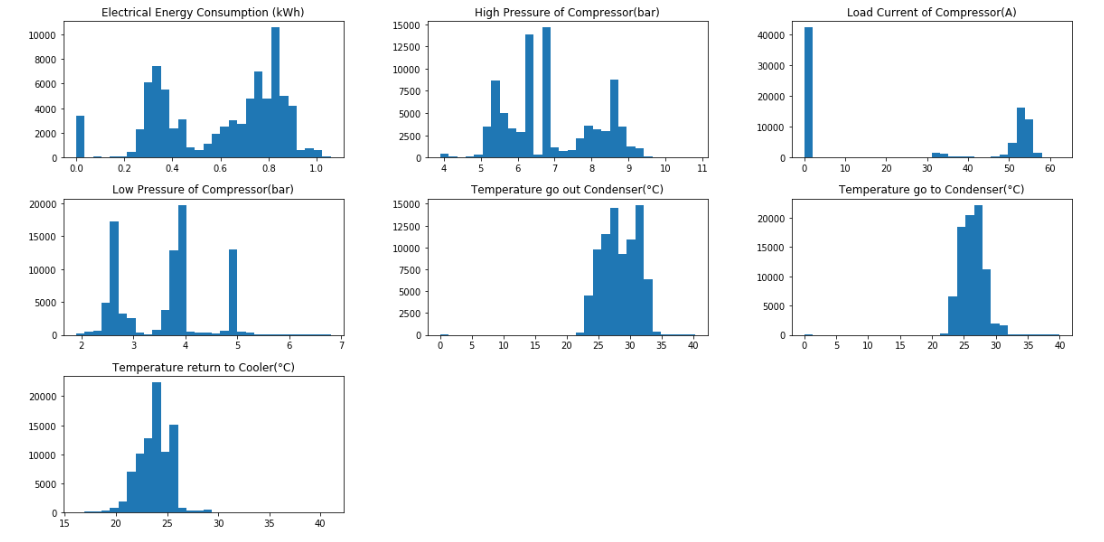
(Example of distribution of chiller machine presented by histogram plot)
It is a good idea to create a histogram to get an idea of the shape of distribution. These analyses would also help to identify outlying and use to double-check data entry errors.
b. Central tendency
The central tendency of a distribution is an estimate of the “center” of a distribution of values. Central tendency aims to provide an accurate description of the entire data. It is the single value that is the most typical/representative of the collected data. The term “number crunching” is used to illustrate this aspect of data description. There are three major types of estimates of central tendency: Mean, Median, Mode.
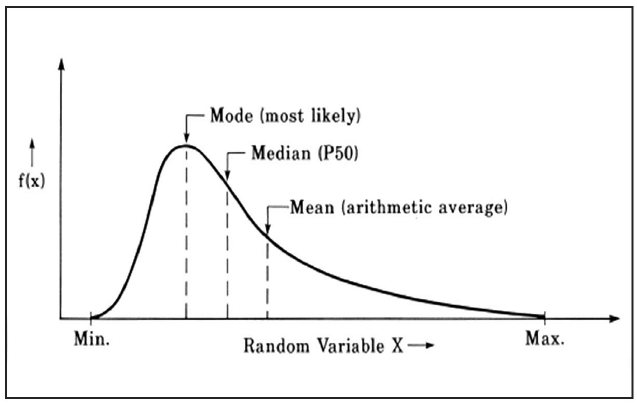
(Source: ResearchGate)
c. Dispersion
In statistics, the measure of central tendency gives a single value that represents the whole value; however, the central tendency cannot describe the observation fully. The measure of dispersion helps us to study the variability of the items. In a statistical sense, dispersion has two meanings: first, it measures the variation of the items among themselves, and second, it measures the variation around the average. If the difference between the value and average is high, then dispersion will be high. Otherwise, it will low. Researchers use this technique because it determines the reliability of the average. Dispersion also helps researchers in comparing two or more series. There are two common measures of dispersion, the range, and the standard deviation. The range is simply the highest value minus the lowest value. The Standard Deviation is a more accurate and detailed estimate of dispersion because an outlier can greatly exaggerate the range.
4. Diagnostic analysis
(Source: Governance Analytics)
This is the next step of complexity in data analytics. Diagnostic analytics describes the techniques to describe “why did this happen?”. On assessment of the descriptive data, diagnostic analytical tools will empower an analyst to drill down and in so doing isolate the root cause of a problem. It helps get value out of collecting data by asking the right questions and making deep dives for the answers. This includes using processes such as data discovery, data mining, correlation, drill down and drill through.
Diagnostic analysis is one of the ways we uncover insights from our data and make it gain value for us. There are infinite ways to ask questions of data. Therefore, concentrate on which question are the most critical part in manufacturing. The goal of any all analytics should be more relevant information, which will lead to more valuable decisions and a more complete understanding in the factory.
5. Predictive analysis
Predictive analysis is a branch of advanced analytics. Predictive analysis is all about forecasting. Predictive models can estimate a quantifiable amount or a point in time at which something might happen. Predictive models typically utilize a variety of variable data to make the prediction.
Any industry is turning to predictive analysis to help solve difficult problems and uncover new opportunities. The first thing is that predictive analysis can help improve operations. Predictive model can be used to manage resources. For example, the coal will be used in steam boiler machine. From that, it enables machines/equipment to function more efficiently. Second, it helps the manufacturer reduce risk. It helps to forecast when part of the machine will be broken. Therefore, the engineer can maintenance it on time. By predicting maintenance, it helps to reduce downtime for the factory.
For manufacturers, it’s very important to identify factors leading to reduced quality and production failures, as well as to optimize parts, service resources and distribution. Lenovo is just one manufacturer that has used predictive analytics to better understand warranty claims – an initiative that led to a 10 to 15 percent reduction in warranty costs.
6. Prescriptive Analysis
Prescriptive analysis is a type of data analytics—the use of technology – to help businesses make better decisions through the analysis of data. Specifically, prescriptive analytics factors information about possible situations or scenarios, available resources, past performance, and current performance, and suggests a course of action or strategy. It can be used to make decisions on any time horizon, from immediate to long term. The opposite of prescriptive analytics is descriptive analytics, which examines decisions and outcomes after the fact.
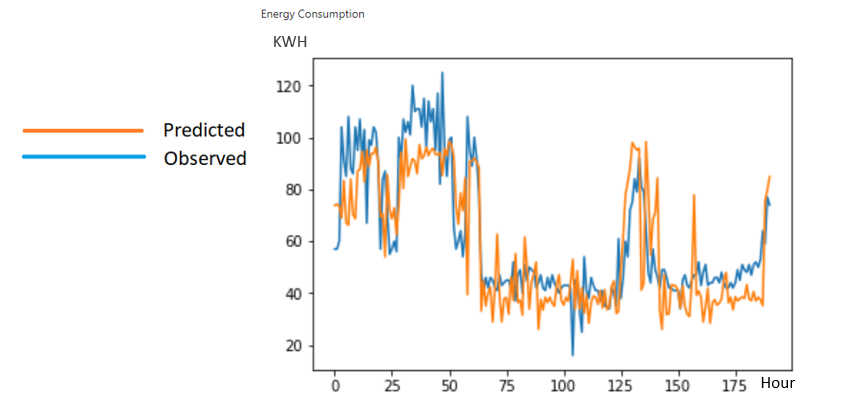
(Example of Prescriptive analysis of chiler machine)
Prescriptive analytics relies on artificial intelligence techniques, such as machine learning to understand from the data acquired. Machine learning power makes it possible to process a large amount of data collected by IoT devices. When the new data is added, the computer program adjusts automatically to make use of it. Prescriptive analytics works with another type of data analytics, predictive analytics, which was introduced above. However, it goes further: Using the predictive analytics’ estimation of what is likely to happen, it recommends what future course to take. For an example of the chiller machine, whenever the new input comes, the computer program can calculate what the value of energy consumption should be.
Conclusion
In this article, several types of data analysis are introduced. Each of these types of data analysis is connected and relies on each other to certain degree. Each of them is used for a different purpose and provide varying insight. Therefore, it is important to understand and use correctly these types of analysis. In the next article, we will investigate how to apply machine learning and build a model to gain benefits. If you have any questions, feel free to contact us at Email: info@daviteq.com.
Vibration velocity sensor Daviteq


Comments are closed.