
 Tiếng Việt
Abstract: In the last article, the benefits of machine learning were introduced. The question is how to be able to apply this technique into manufacturing? The diagram below shows basic steps on how to apply machine learning techniques. The aim of this article mainly introduces the first two basic steps: Data acquisition and data cleaning. The way how to obtain raw data will be discussed in the first part. Next, raw data is often incomplete, inconsistent, and is likely to contain some noise (outlier). For that reason, cleaning data is the necessary step. How to deal with incomplete data will be discussed in the next part.
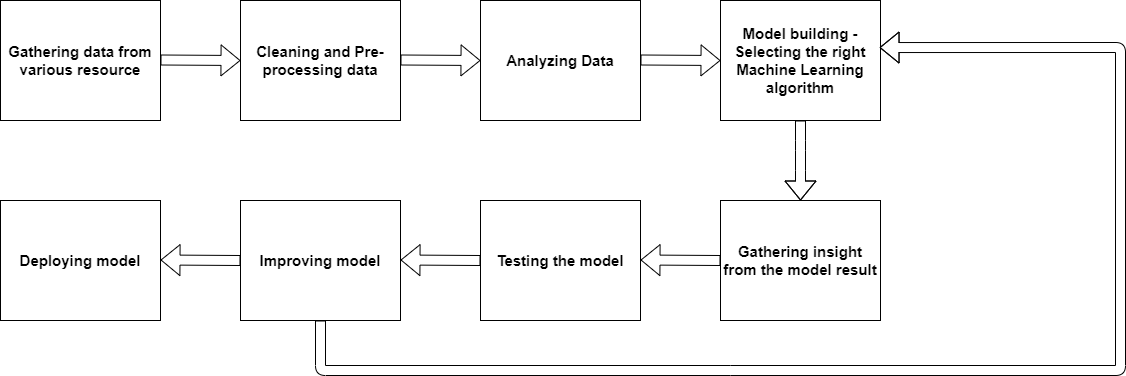
General steps in how to apply machine learning
1. Data acquisition
1.1 IOT system architecture for Data acquisition
While every IoT system is different, the foundation for each Internet of Things architecture as well as its general data process flow is roughly the same. First of all, it consists of the Things, which are objects connected to the Internet which by means of their embedded sensors and actuators are able to sense the environment around them and gather information that is then passed on to IoT gateways. The next stage consists of IoT data acquisition systems and gateways that collect the great mass of unprocessed data, convert it into digital streams, filter and pre-process it so that it is ready for analysis. The third layer is represented by edge devices responsible for further processing and enhanced analysis of data. This layer is also where visualization and machine learning technologies may step in. After that, the data is transferred to data center which can be either cloud-based or installed locally. This is where the data is stored, managed and analyzed in depth for actionable insights [1].
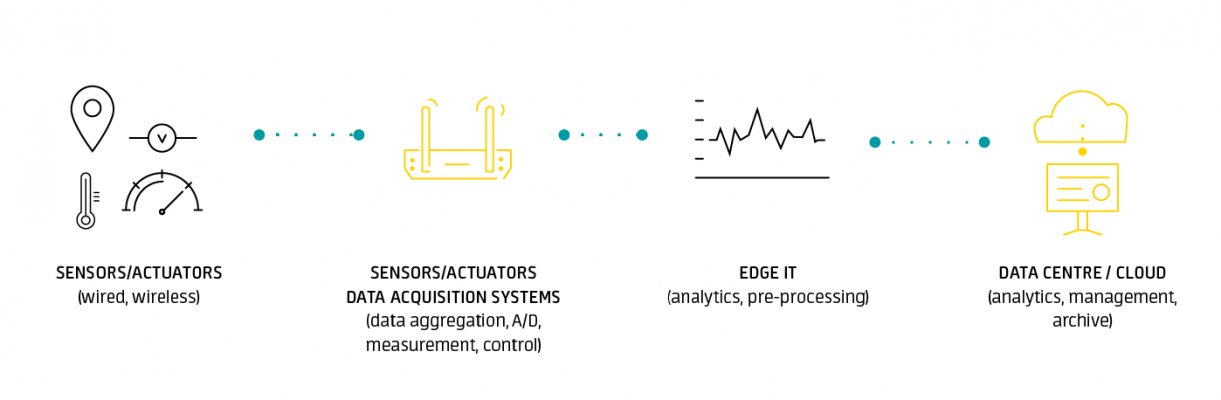
IoT system architecture for data acquisition
1.2 Wire and Wireless technologies
IoT system might wired, wireless or hybrid connection to establish the system. Wired connection is reliability, and high speed but lack of mobility, high deployment costs, cable damage, and difficulties with scalability while wireless connection is convenience, large monitoring area, and becoming more cost effective but short battery life, slower speeds , complex to configure, and limited signal range [2]
Wired connection is the term refers to any physical medium consisting of cables. The cables can be copper wire, twisted pair or fiber optic. Wired network is used to carry different forms of electrical signals from one end to the other [4]. The wired communication is divided into two categories internal communication such as I2C, SPI and external communication such as Ethernet, RS-232, RS-485, UART, USART, USB [3]
Wireless is the connection made of electromagnetic (radio waves or infrared waves). All the wireless devices will have antenna or sensors [4]. Wireless technology is rapidly evolving and playing an increasing role in the lives of people throughout the world. Various technologies and devices are being developed in response to the growing use of wireless. Wireless access technologies are commonly divided into categories, based on speed and distance: Wireless Personal Area Network (WPAN), Wireless Local Area Network (WLAN), Wireless Metropolitan Area Network (WMAN), and Wireless Wide Area Network (WWAN) [6]. For wireless communication, various technologies are available. Following table show comparison among typical technologies in term of frequency, data rate, range, power usage and cost [5]
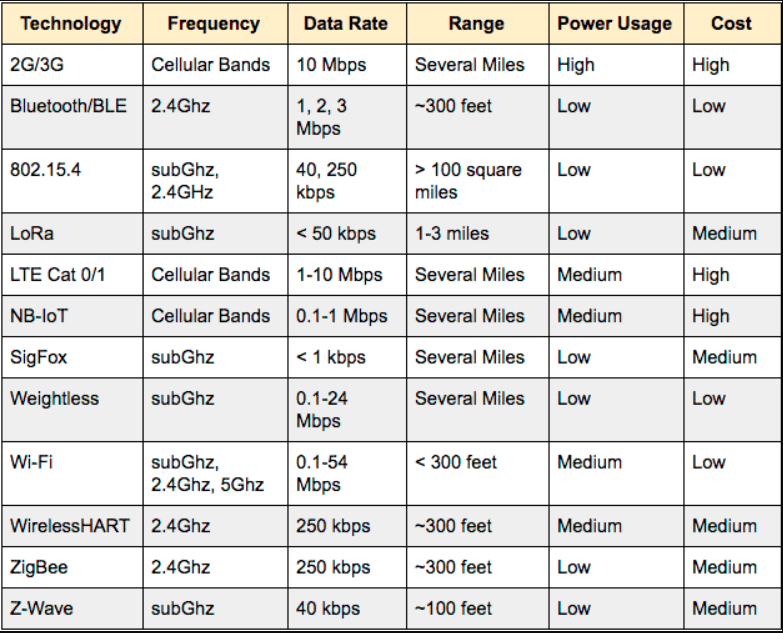
Comparison table among typical wireless technologies
1.3 Sub-Ghz wireless IoT network
1.3.1 Sub-ghz IoT network
For all IoT adopters, being able to distinguish between sub-GHz and 2.4 GHz ISM bands is a major help in your wireless technology decision. According to Behrtech, in comparison to 2.4Ghz band, sub-Ghz bands are much longer range, less external radio interference, more power efficient, and less infrastructure cost [7]. Sub-Ghz sensor network is typical application of sub-Ghz technology. System architecture of sub-Ghz wireless network includes wireless sensor and a wireless receiver/co-ordinator which connect in star typology as below figure [8]
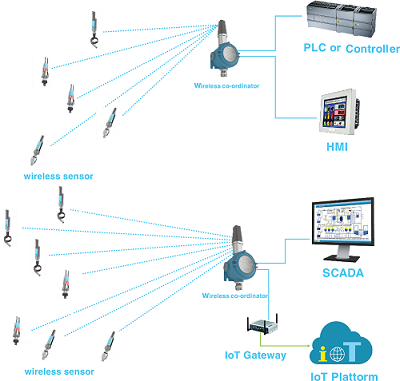
System structure of Sub-Ghz sensor network
The IoT domain is characterized by many applications that require low-bandwidth communications over a long range, at a low cost and at low power. Low power wide area networks (LPWANs) fulfill these requirements by using sub-GHz radio frequencies (typically 433 or 868 MHz) with typical transmission ranges in the order of 1 up to 50 km. As a result, a single base station can cover large areas and can support high numbers of connected devices (>1000 per base station). Notorious initiatives in this domain are Sigfox and LoRaWAN standard [9].
1.3.2 Sigfox network
Sigfox employs the differential binary phase-shift keying (DBPSK) and the Gaussian frequency shift keying (GFSK) that enables communication using the Industrial, Scientific and Medical ISM radio band which uses 868MHz in Europe and 902MHz in the US. Sigfox has partnered with a number of firms in the LPWAN industry such as Texas Instruments, Silicon Labs and ON Semiconductor. The existing standard for Sigfox communications supports up to 140 uplink messages a day, each of which can carry a payload of 12 octets at a data rate of up to 100 bits per second [10]. The Sigfox network consists of objects (end user devices), sigfox gateway or base stations, sigfox cloud and application servers. Sigfox objects are connected with Gateway using star topology. There is direct secure point to point link between sigfox gateways and sigfox cloud. The cloud interfaces with servers using different protocols such as SNMP, MQTT, HTTP, IPv6 etc. as per end applications [11].
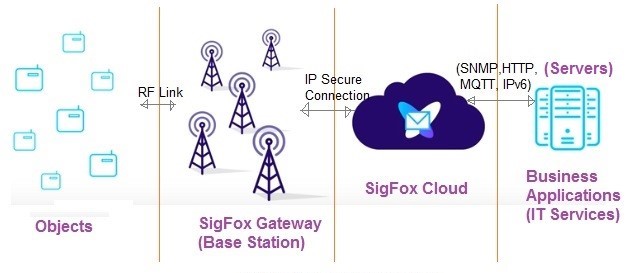
Sigfox network architecture
1.3.3 LoRaWAN Network
In addition to Sigfox, LoRaWAN is another popular LPWA technology. The LoRaWAN® specification is a Low Power, Wide Area (LPWA) networking protocol designed to wirelessly connect battery operated ‘things’ to the internet in regional, national or global networks, and targets key Internet of Things (IoT) requirements such as bi-directional communication, end-to-end security, mobility and localization services [12]. LoRaWAN uses star topology as it increases battery lifetime when long-range connectivity is used [13].
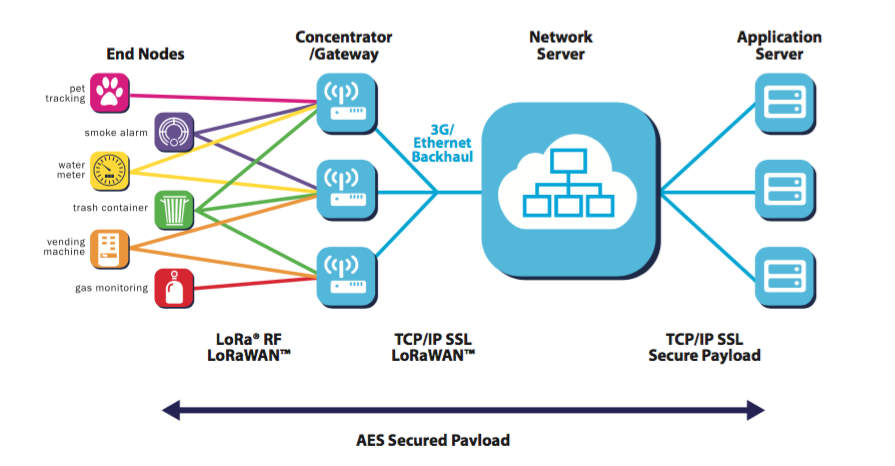
LoRaWAN Network Architecture
2. Data cleaning
After collecting data through IOT devices, raw data often contain many problem such as missing value, outlier, redundant features,. There are several things to preprocess raw data before analyses those data to gain information:
- Standardize/Normalize data
- Detect and identify missing value
- Detect and process abnormally value
- Encode feature
- Reduce redundant feature
2.1 Data standardization and normalization
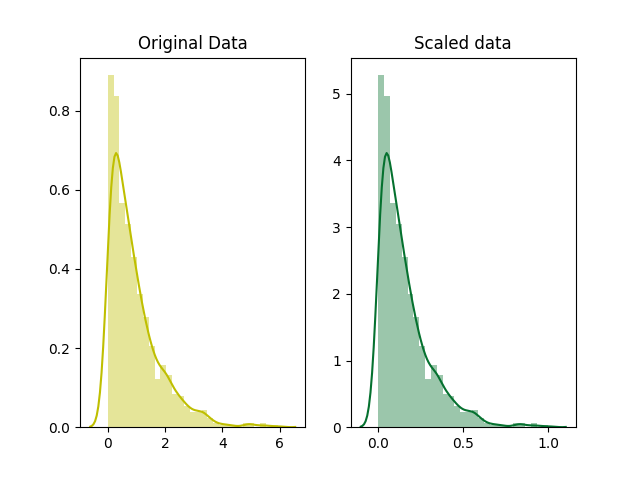
(Source: Harshit Kumar)
Variables that are measured at different scales do not contribute equally to the analysis and might end up creating a bias. Standardize the feature around the center and 0 with a standard deviation of 1 is important when we compare measurements that have different units. For example, standardize value range between 0 – 1000 to 0 – 1 greatly reduce the bias when data are used to analyze
Similarly, the goal of normalization is to change the values of numeric columns in the dataset to a common scale, without distorting differences in the ranges of values. For machine learning, every dataset does not require normalization. It is required only when features have different ranges. Another example consider the dataset of the machine that has a temperature (0 – 100 °C) and pressure (0 – 9 atm). Since 2 features are in different range, further analysis may be affected like multivariate linear regression. The attribute income will intrinsically influence the result more due to its larger value. Normalize data to make value in the same range in order to reduce the bias.
2.2 Missing value identification

Due to connection or device error, the common problem is incomplete raw data. Although the simplest way is to delete the missing value, this approach is not rationale as it can result in an enormous loss of missing value and the consequence might be a decrease in classification accuracy. For that reason, imputation method is the most common way to handle missing value. Imputation method transforms original data to complete data before training a model or performing data analyzing task. The advantage of this method is that it can be used with any classification algorithm and deal with a large number of missing values. Two traditional imputation method are single imputation and multiple imputation. Thus, selecting a suitable imputation method is heavily based on the given dataset. However, single imputation has an advantage in terms of running time over multiple imputation.
2.3 Outlier detection
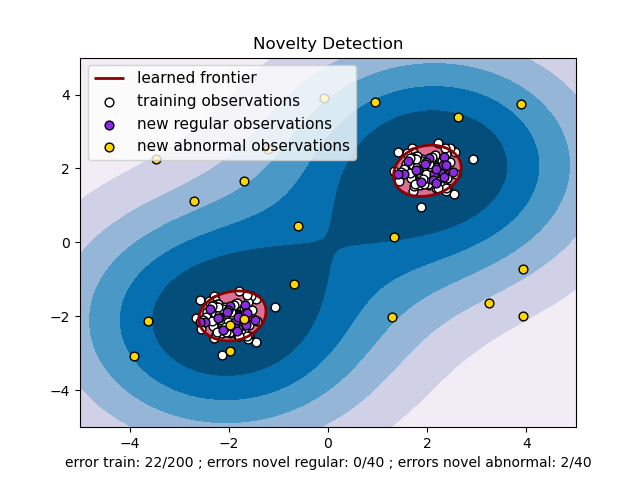
(Source: sklearn)
The reason why it has outlier in manufacturing often come from measurement error or device error. Many applications require being able to decide whether a new observation belongs to the same distribution as existing observations (it is an inlier), or should be considered as different (it is an outlier). The outlier is usually defined as some value that is line far away from normal values. Because of the huge difference between normal value and outlier, the outlier can lead to distorting reality and can also cause a big problem in statistical procedure. Outliers should be investigated carefully. Often, they contain valuable information. Before eliminating it, one should try to understand why the dataset contains outliers. In general, outliers can be good either bad.
2.4 Encoding Feature
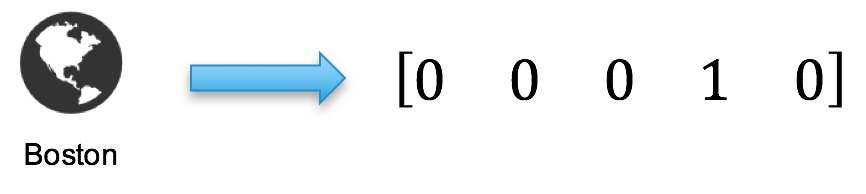
(Source Dzone)
In machine learning projects, one important part is feature engineering. It is very common to see categorical features in a dataset. However, our machine learning algorithm can only read numerical values. It is essential to encoding categorical features into numerical values. The two most popular techniques are an Ordinal Encoding and a One-Hot Encoding.
2.5 Feature selection
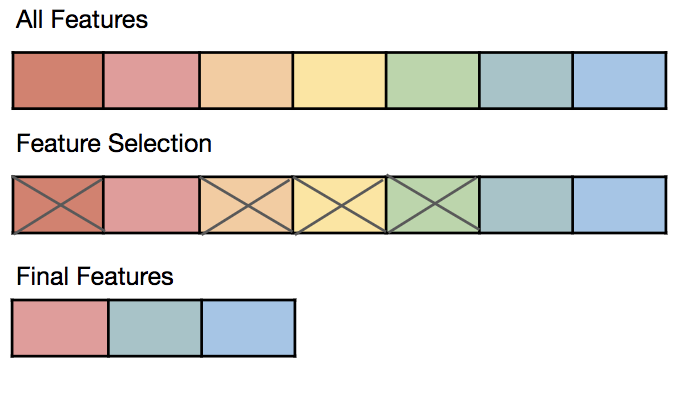
(Source: KDnuggets)
In machine learning and statistics, feature selection, also known as variable selection, attribute selection or variable subset selection, is the process of selecting a subset of relevant features (variables, predictors) for use in model construction. We all may have faced this problem of identifying the related features from a set of data and removing the irrelevant or less important features with do not contribute much to our target variable in order to achieve better accuracy for our model. Irrelevant or partially relevant features can negatively impact model performance. Feature importance scores can provide useful information such as:
Feature importance scores can provide insight into the dataset. The relative scores can highlight which features may be most relevant to the target, and the converse, which features are the least relevant. This may be interpreted by a domain expert and could be used as the basis for gathering more or different data.
Feature importance scores can provide insight into the model. Most importance scores are calculated by a predictive model that has been fit on the dataset. Inspecting the importance score provides insight into that specific model and which features are the most important and least important to the model when making a prediction. This is a type of model interpretation that can be performed for those models that support it.
Feature importance can be used to improve a predictive model. This can be achieved by using the importance scores to select those features to delete (lowest scores) or those features to keep (highest scores). This is a type of feature selection and can simplify the problem that is being modeled, speed up the modeling process (deleting features is called dimensionality reduction), and in some cases, improve the performance of the model.
3. Conclusion
In this article, the way to obtain raw data and process incomplete raw data which is a crucial step in any Machine Learning process was introduced. Those is an important step in the Machine Learning process. In the next article, analyzing task will be investigated. If you have any question, feel free to contact us at Email: info@daviteq.com
Thanks for reading!


Comments are closed.